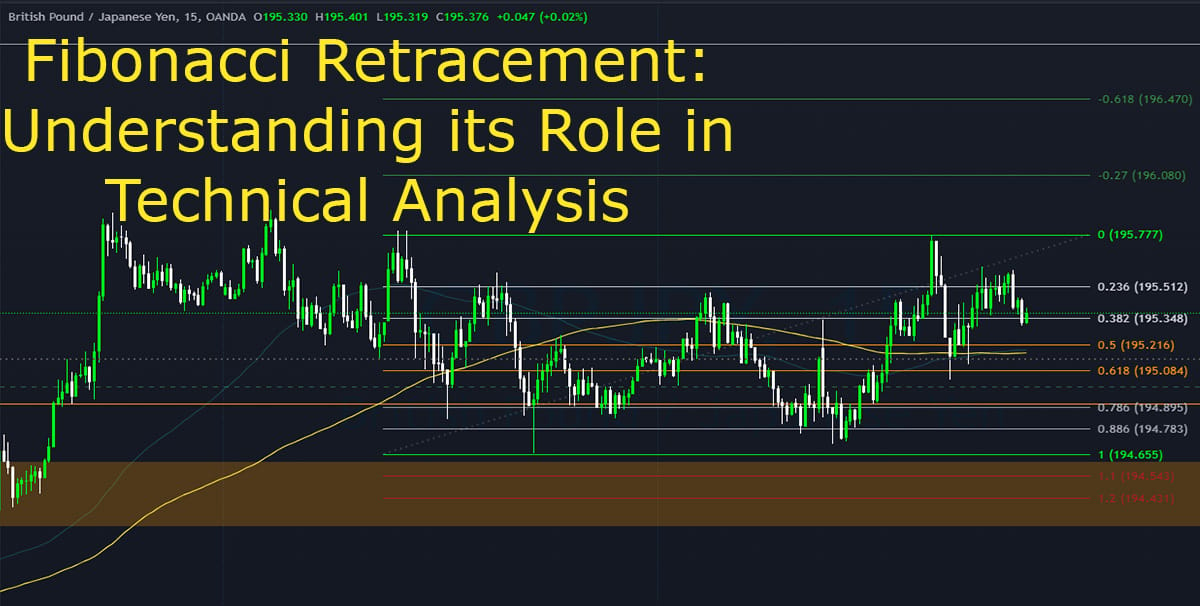
The Fibonacci tool is a trader's secret weapon, rooted in the mathematical sequence found in everything from nature to financial markets. This tool helps identify potential support and resistance levels by measuring key retracement and extension zones during price movements. Whether you’re catching a pullback in a trend or pinpointing where a reversal might occur, Fibonacci levels offer a roadmap for navigating the chaos of the markets.
Here’s how it works: by drawing the Fibonacci tool between a significant high and low, traders can identify percentages levels like 38.2%, 50%, and 61.8%—where price often stalls or reverses. These zones become critical for timing entries, setting stop losses, or even targeting profits. The beauty of Fibonacci is its versatility; it works across all timeframes and market conditions, giving traders a structured approach to analyzing price action. When combined with other tools like trendlines or candlestick patterns, Fibonacci levels can transform a decent strategy into a precise, high-probability one.
More to come

🥛Don Leche’s Takeaway 🥛
Trust in the Probabilities Trading anxiety often arises because of the illusion that you can control the outcome of every trade. You can’t. What you can control is how consistently you execute your plan. Trust that over time, your edge will play out in your favor. A simple yet massive reminder is that trading is a marathon, not a sprint. The market isn’t your enemy—it’s a reflection of your own mindset. By taking deliberate steps to manage stress and build trust in yourself, you can trade with a clear head and steady hand.

